MySQL Cluster
A project can have a number of sites and you can manage them all in this section.
Backups
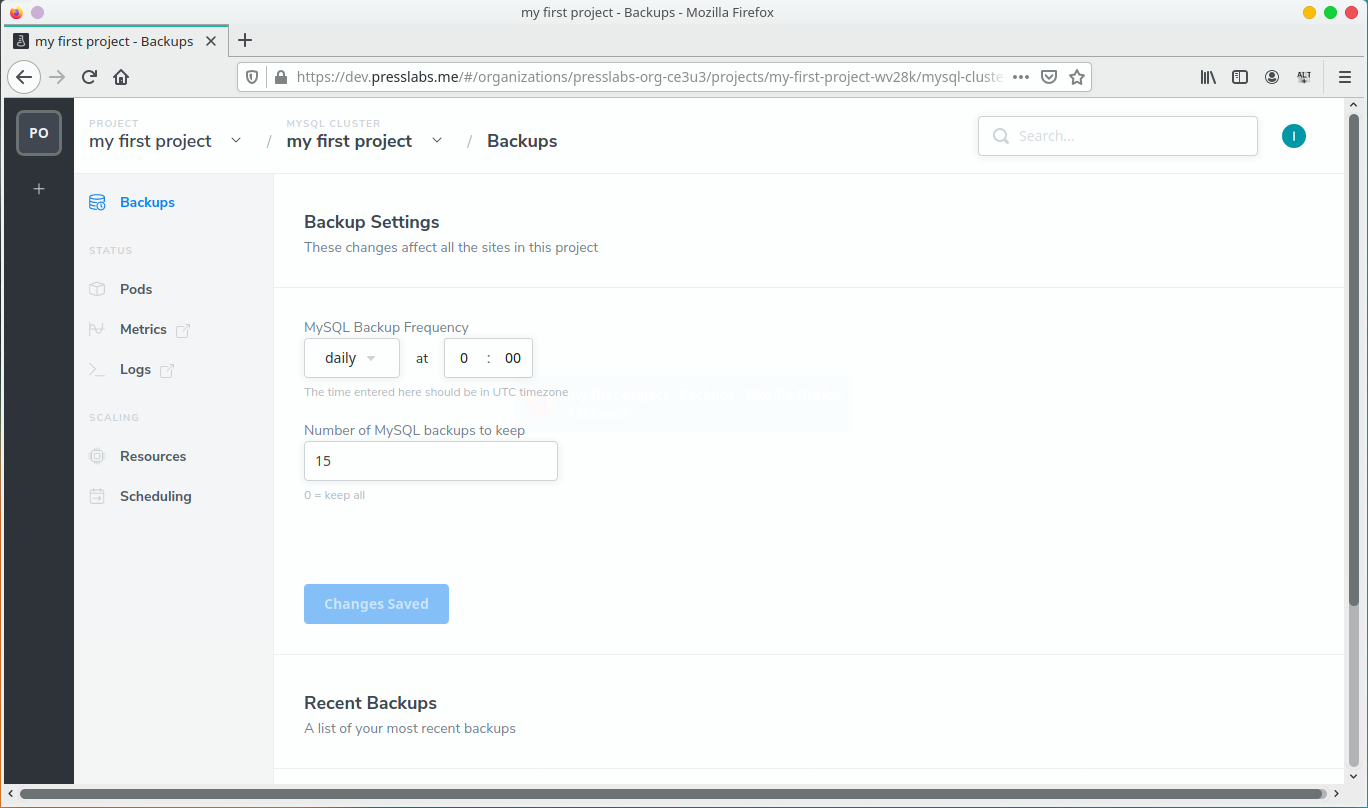
The Backups section allows you to setup the MySQL backup frequency and the number of MySQL backups to keep. You also have a list of your recent backups.
Status Section
In the Status section of your MySQL cluster, you can view all your MySQL pods, access Grafana metrics and Google Cloud logs.
Pods
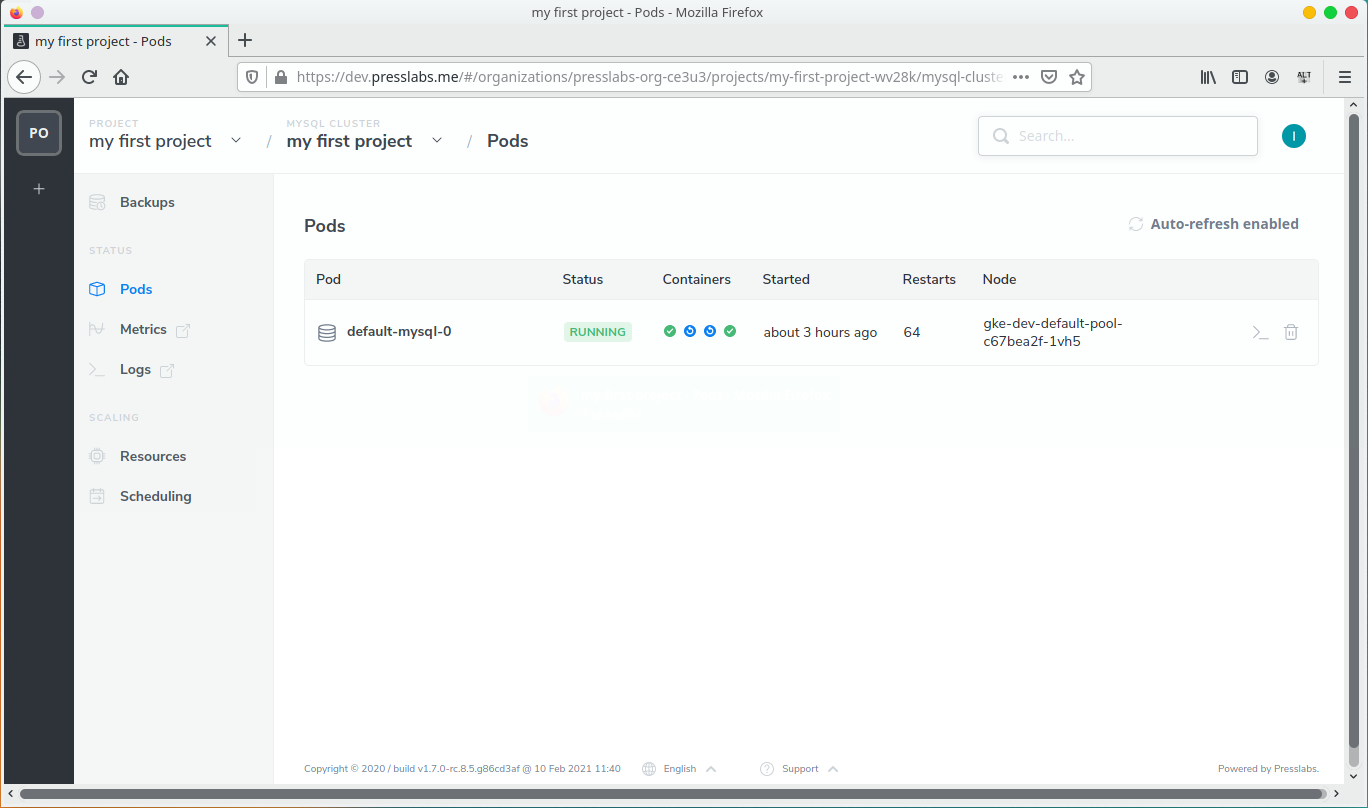
Here you can see all your MySQL pods and details about them, such as if they are running, started date, number of restarts, the kind and the node. You can easily access any Google Cloud pod from here and you can also delete it.
Metrics
Here you have a shortcut taking you to Grafana to see various metrics about your MySQL cluster.
Logs
When you click on the Logs section, you’ll be redirected to your Google account, to the Google logging page, where you can see your database logs.
MySQL Resources
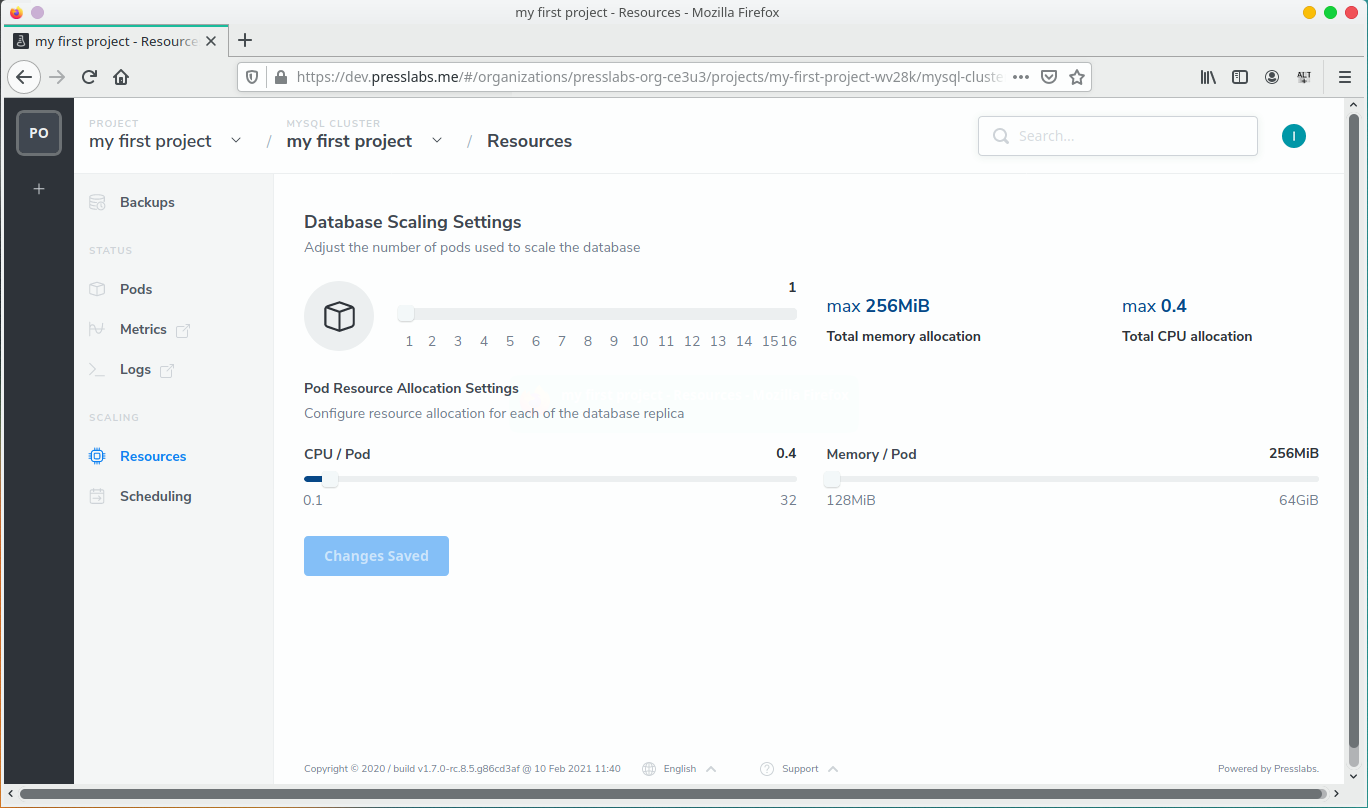
On the Resource Allocation section you can scale the MySQL cluster and configure the resource allocation for each database replica, like CPU/Pod and Memory/Pod.
MySQL Scheduling
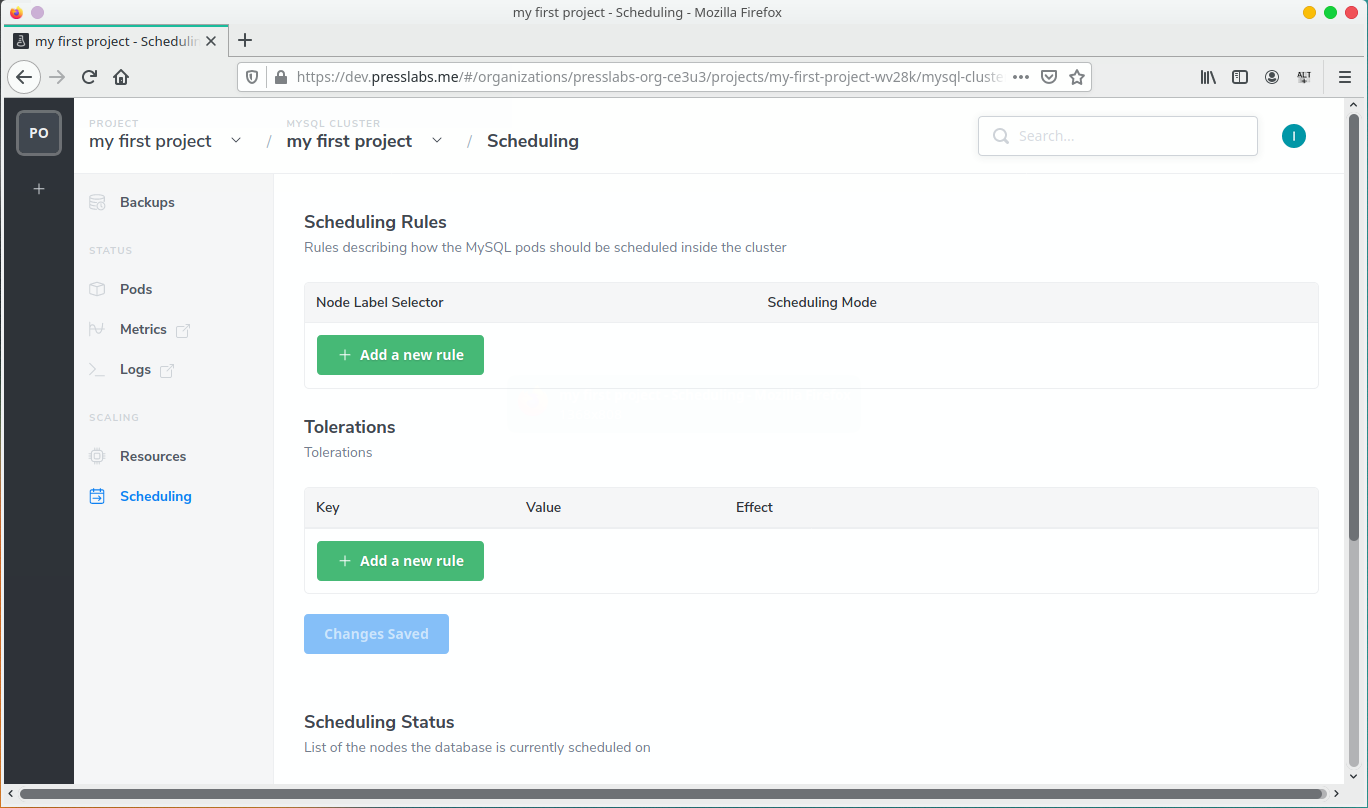
This section allows you define rules on how the MySQL pods should be scheduled inside the cluster, setup tolerations and also contains a list of the nodes where the database is currently scheduled on.
WARNING
- Be very careful with these settings, as they can break your site, Memcached or MySQL cluster. Before setting up a certain rule, make sure that you have the necessary nodes available.
- All the scheduling modifications (setting up scheduling rules, tolerations, pod deletions and k8s node upgrades) might be with downtime.